
Software design
USING UML TO DO WEB APPLICATION DESIGN
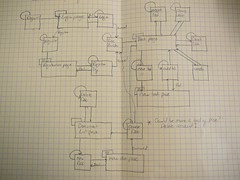
Consilience UML Chart
In case anyone's curious, this is the UML chart with WAE I churned out for my To-Do manager. The model is pretty simple: Users have Lists, Lists (called "Documents") have Tasks, Tasks have DoneDates. Task properties include a minimal number of days that a task can be allowed to slide, and a maximal amount. An algorithm, initially in python but I intend to migrate it to javascript and do the math on the client to reduce server load, figures out how to decorate the task list based upon the task profile and a collection of done dates "around today."
This chart is very shorthand-y: in many cases it's a matter of my knowing what I meant. The boxes with circles in the upper right hand corner are controllers; the ones with squares are views. There's some confusion on the chart as to whether or not there are controllers that are view generators; the one labeled "doc builder" appears to be, but there's no corresponding view generating controller, I don't think, for Lists of Lists. There are also weaknesses in WAE that I've never gotten around to addressing, which is that it was first cooked up in 2003 and has almost no sense of ajax or component-driven view management, and has a whole bunch of notation for frames that can't really be ported over to ajax.